Because you know it’s important to use data to drive action, you look at your social media metrics regularly. You chart the growth in your followers and their likes and shares of your posts. But you’re frustrated because you don’t see how this is really affecting your business. You don’t see the value of your social media efforts. Besides, each social media platform has its own metrics—likes, replies, comments, shares, plusses, repins, etc.

Are my efforts on social media driving website conversions and increasing revenue?
You aren’t alone in asking this question. Every single business owner whose company is active on social media wants to know if it’s worth it. If it’s driving business growth. However, it’s not a lost cause. There is a way to monitor whether or not your social media activity is making a real difference in your business.
As an integrated marketing firm, we’ve tried just about every option out there for apps and programs to monitor social media data. We’ve interpreted the insights and poured over the analytics trying to figure out which ones are really important and which are just vanity metrics. Finally, we feel like we’ve found a solution to show return on investment for social media.
So Which Social Media Analytics Matter?
Even though people brag about the number of followers or subscribers, those numbers don’t make a difference. Neither do the number of posts or tweets you crank out.
Google Digital Marketing Evangelist Avinash Kaushik proposes four distinct social media metrics to measure, regardless of the social channel.
Conversation rate:
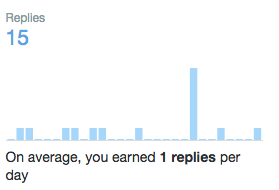 How many people engaged on average per social media post you published this month? On Facebook, Google+, and LinkedIn, this is comments. On Twitter it’s replies.
This metric allows you to find out if you are adding business value to your followers. A high rate means you have a deep understanding of who your audience is and what they are interested in reading, watching, and listening to from your brand.
Amplification rate:
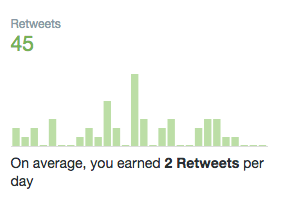
Why is this important? First of all, you know you’re giving your audience content that they consider to be so great they want to share it. Second, over time, if these new readers enjoy your content, they might choose to become part of your first level network (by following you themselves). This grows your influence and keeps those initial engagers following your updates.
Applause rate:
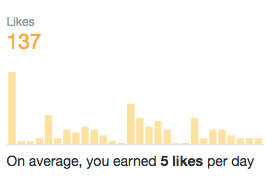
The more likes a post has, the more likely it is to show up for a wider audience. This metric also lets you know to post more of the content your audience finds valuable so that you can get more engagement while simultaneously meeting their needs.
Economic value:
The end goal when analyzing social media insights should be to discover what economic value the activities have created. So what’s the sum value of the short-term revenue, long-term revenue, and cost savings from your social media efforts?
As a result of your social media posts, a small percentage of your social network will visit your main website and choose to do business with you. A few will buy something, some will sign up for your email marketing list, others will contact you to request your services. Each of these actions is a macro or micro conversion, which helps you measure economic value.
How do I prove the worth of our social media efforts?
 Use Google Analytics to compute the economic value of your social actions.
-
Identify all of your site’s micro and macro conversions
(purchasing your book, signing up for your newsletter list, downloading a freebie, contacting you through a form, etc.)
-
Create a goal for each and assign a value for each conversion.
Consider how often users who complete the goal become customers. For example, if 10% of visitors who contact you buy your $1,000 service package, each conversion is worth $100. You would put $100 in the “value” box.
-
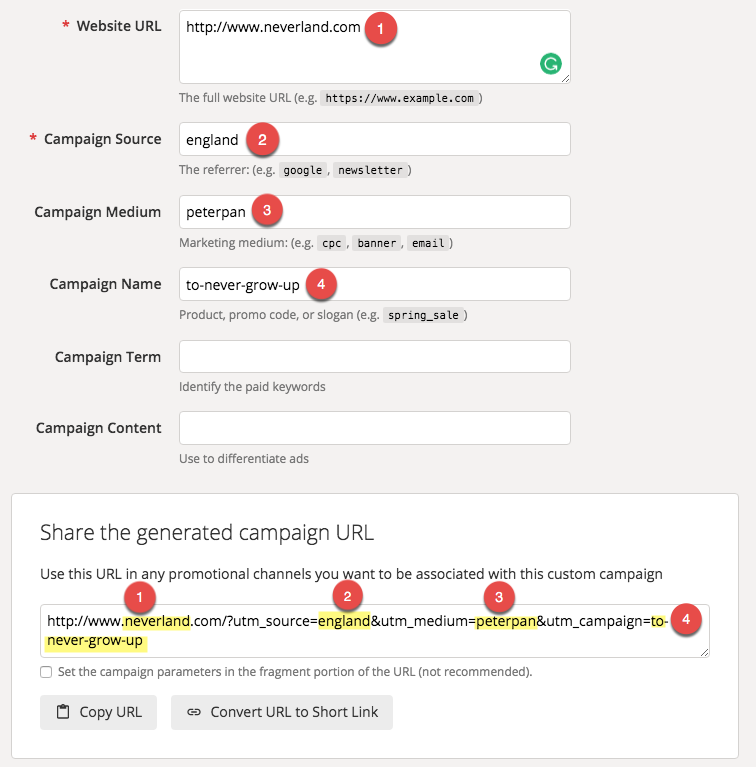
Use Google Analytics’ Campaign URL Builder to create custom urls to match each of your micro and macro conversions with a social media channel.
For example, if you were sharing a “10 Marketing Tips” download on Facebook you would want to use the link you create to share on that medium, so you know how many conversions on that page came from Facebook. You can discover this information through the “Goal Flow” section in Google Analytics.
Campaign URL Builder uses UTM tags to help illustrate the traffic’s path.
-
Destination URL:
Where the traffic’s going (your blog post, landing page, etc.)
-
Source UTM tag:
Where the traffic’s coming from (Facebook, Twitter, LinkedIn, YouTube, etc.)
-
Medium UTM tag:
How the traffic’s getting there (“social,” or for nonsocial you can also monitor traffic from “email,” “blog-guest,” etc.)
-
Campaign UTM tag:
Why the traffic’s going there (launch-, persona-[name], promotion-[lead magnet], contact-lead, etc.)
So the point is: monitor metrics that prove the value of your social media efforts
If those last few steps seem a little complicated, just walk through Google Analytics’ tutorial section. Once you get your goals set up, you no longer have to sift through so many social media metrics. There’s an easy solution.
A website called True Social Metrics tracks Kaushik’s four distinct social media metrics. You just link your social media accounts and your Google Analytics. It computes the rest! So capture and calculate the analytics yourself, or take the simpler route of True Social Metrics. Either way, start monitoring metrics that actually matter—the real active engagement of your social media followers
 Branding
 Strategic Marketing
 Creative Concepts
 Web Services
 AI Services
 Speaking & Consulting
 Website Maintenance
 Careers
 Tools We Suggest
 10 Tips to Transform Your Marketing
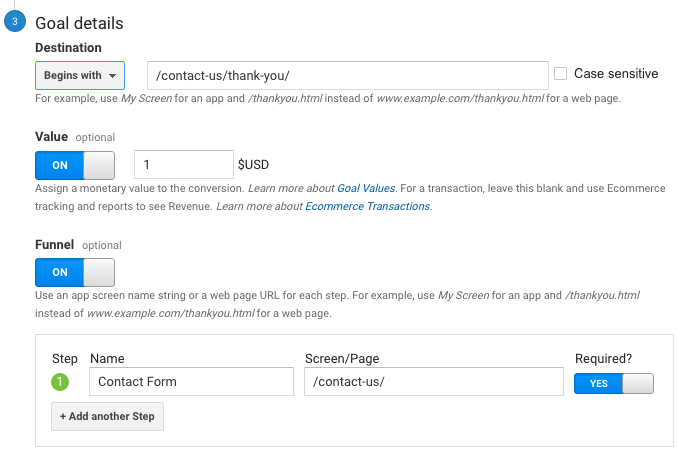 Use Google Analytics to compute the economic value of your social actions.
 Destination URL:



0 Comments